Welcome to the AwareManager IQ Dashboard!
Getting Started
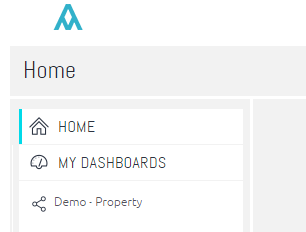
In order to access your dashboard, please select the link on the left under the MY DASHBOARD section.
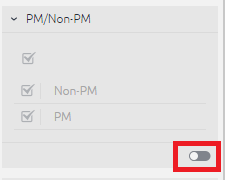
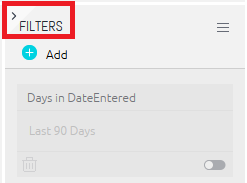
Enable Filters
To filter the data shown on your dashboard, use the filters on the right of the page. Use the toggle icon on the bottom right of a filter to enable it.
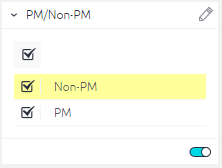
Toggle Filters
Once a filter has been enabled, you can toggle it by selecting/deselecting the checkboxes.
Hide Filters
You can hide the filter panel by clicking the > icon in the top left of the panel to the left of "Filters". To configure additional filters, please contact your client manager.
Drill Down
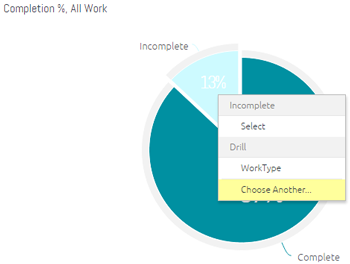
To drill down into a dashboard, right click on a segment of the chart or graph and choose “Drill Into”. You’ll see any previously selected criteria available as well as the option to "Choose Another…" selection of the data to drill into.
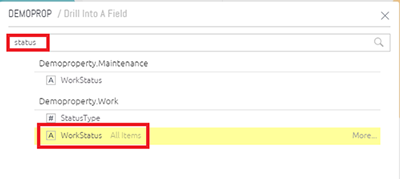
Keyword Filter
If selecting additional criteria, use the keyword filter at the top of the chooser window to narrow down your selection:
Example
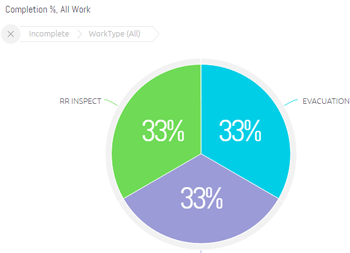
In this example, we took the Incomplete/ Complete pie graph and drilled into the Incomplete data to break out the information by Work Status:
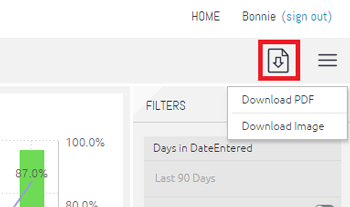
Download
In order to download your dashboard as a PDF or image file, select the download icon in the top right of the page: